
Mice
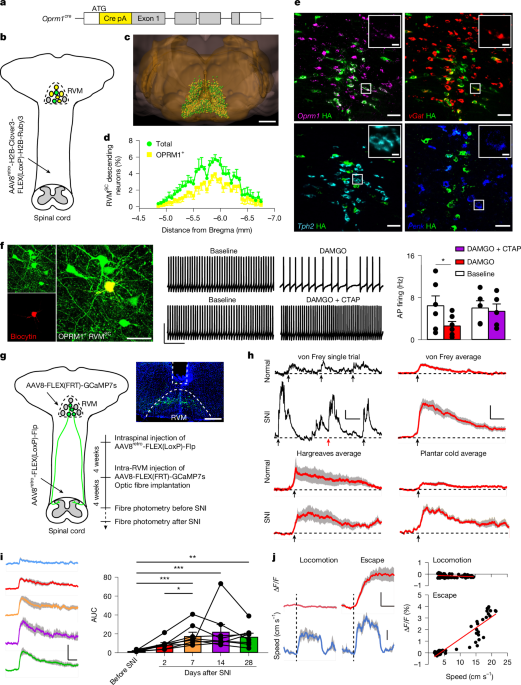
All procedures were in accordance with the US National Institutes of Health (NIH) guidelines for the care and use of laboratory animals and were approved by Stanford University’s Administrative Panel on Laboratory Animal Care. Mice (1.5 days–10 weeks) of both sexes were used in experiments. Genetically engineered mouse lines used in this study included Oprm1cre/+ and vGlut2-IRES-cre (JAX 016963). The Oprm1cre/+ knock-in mouse line was generated in the Stanford University Transgenic, Knockout and Tumor Model Center (TKTC) using conventional embryonic-stem-cell-targeting strategies. The Cre recombinase cDNA, followed by the rabbit β-globin poly-A signal, was introduced by homologous recombination immediately after the start codon in exon 1 of the mouse Oprm1 gene51 (Extended Data Fig. 1a). Heterozygous mice were generated by mating chimeric mice with C57BL/6 mice.
Viruses
The following viruses were produced and packaged in the laboratory and used in this study: AAV8retro-hSyn-H2B-Clover3-FLEX(LoxP)-H2B-mRuby3 (2.0 × 10¹³ genome copies (gc) per ml), AAV8retro-CAG-mCherry (5.0 × 10¹² gc ml−1), AAV2retro-CAG-eGFP (5.0 × 10¹² gc ml−1), AAV8-hSyn-FLEX(FRT)-mCherry (1.0 × 10¹³ gc ml−1), AAV8-hSyn-FLEX(FRT)-Clover3 (1.0 × 10¹³ gc ml−1), AAV8-hSyn-FLEX(FRT)-hM4D-IRES-EGFP (2.0 × 10¹³ gc ml−1), AAV8-hSyn-FLEX(FRT)-hM3D-EYFP (3.0 × 10¹³ gc ml−1), AAV8-hSyn-FLEX(FRT)-taCaspase3-TEVp (1.0 × 10¹³ gc ml−1), AAV8-hSyn-FLEX(LoxP)-Ruby3-FLEX(FRT)-Clover3 (1.0 × 10¹³ gc ml−1), AAV8retro-hSyn-FLEX-mTagBFP2-P2A-FlpO (5.0 × 10¹³ gc ml−1), AAV8retro-hSyn-mTagBFP2-P2A-Cre (5.0 × 10¹³ gc ml−1), AAV8-hSyn-FLEX(LoxP)-hM4D-IRES-GFP (5.0 × 10¹³ gc ml−1), AAV8-hSyn-FLEX(LoxP)-hM3D-IRES-mCherry (1.0 × 10¹³ gc ml−1), AAV8-hSyn-FLEX(LoxP)-hM3D-IRES- EGFP (1.0 × 10¹³ gc ml−1), AAV8-hSyn-FLEX(FRT)-jGCaMP7s (5.0 × 10¹³ gc ml−1), AAV1-hSyn-Cre (1.0 × 10¹³ gc ml−1), AAV8-hSyn-hM4D-mCherry (5.0 × 10¹² gc ml−1), AAV8-hSyn-hM3D-mCherry (5.0 × 10¹² gc ml−1), AAV8-EF1α-FLEX(LoxP)-mScarlet (1.0 × 10¹³ gc ml−1), AAV8-Ef1a-DIO-hChR2(H134R)-EYFP (5.0 × 10¹² gc ml−1), AAV8-hSyn-FLEX(FRT)-EGFP-P2A-TVA-T2A-oG (5.0 × 10¹³ gc ml−1). SADΔG-mCherry(EnvA) (2.0 × 10⁸ infectious unit (IU) ml−1) was purchased from Salk viral core, CVS-N2cΔG-mCherry(EnvA) (5.0 × 10⁸ IU ml−1) was purchased from Jefferson Center for Vaccines. AAV5-Ef1a-DIO-hChR2(H134R)-mCherry (1.2 × 10¹³ gc ml−1, Addgene 20297) and AAV2-hSyn-DIO-hM4D(Gi)-mCherry (1.2 × 10¹³ gc ml−1, Addgene 44362) were purchased from Addgene.
Surgery
Stereotaxic injection and implantation of optical fibres and cannulas
Stereotaxic surgeries were performed on five- to seven-week old mice under ketamine and xylazine (100 mg kg−1 and 5 mg kg−1, intraperitoneally; i.p.) anaesthesia using a stereotaxic instrument (BenchMARK Digital, Leica). Virus was injected into the RVM (200 nl AAV, Bregma −5.60 mm, lateral ±0.1 mm, ventral 5.75 mm), lSuC (200 nl AAV, Bregma −3.45 mm, lateral ±1.65 mm, ventral 2.40 mm), PAG (250 nl AAV, Bregma −4.65 mm, lateral ±0.5 mm, ventral 3 mm), SSp and SSs (200 nl AAV at site 1: Bregma −1.45 mm, lateral ±3.75 mm, ventral −1.45 mm; 200 nl AAV at site 2: Bregma −1.65 mm, lateral ±3.85 mm, ventral −1.55 mm), MOa (200 nl AAV, Bregma +1.8 mm, lateral ±1.5 mm, ventral −1.35 mm), VPL (200 nl, Bregma −1.8 mm, lateral ±2.0 mm, ventral 3.5 mm), Po (200 nl, Bregma −1.8 mm, lateral ±1.6 mm, ventral 2.85 mm), DCN (70 nl per injection, at site 1: obex 0.0 mm, lateral ±0.6 mm, ventral −0.25 mm; site 2: obex 0.25 mm, lateral ±0.8 mm, ventral −0.3 mm; site 3: obex 0.5 mm, lateral ±1.1 mm, ventral −0.35 mm) with a pulled glass capillary at a slow rate (100 nl min−1) using a pressure microinjector (Micro4 system, World Precision Instruments). The injection capillary was removed 5 min after the end of the injection. For mice used for terminal chemogenetic manipulation or fibre photometry, an infusion cannula (PlasticsOne) or optical fibre (Inper) was placed at least 200 μm above the target brain region and cemented to the skull using dental cement (Lang Dental Manufacturing). After surgery, a dummy cannula was inserted and a cap was screwed on to keep the guide cannula from becoming occluded. Mice were allowed at least two weeks to recover and to express the virus before behavioural training commenced.
SNI
SNI surgery were performed as previously described21 on five- to seven-week old mice under ketamine and xylazine (100 mg kg−1 and 5 mg kg−1, i.p.) anaesthesia. In brief, after skin incision and blunt dissection to expose the sciatic nerve, the tibial and common peroneal branches of the sciatic nerve were ligated with a 5.0 silk suture and transected distally. The sural nerve was left intact. For sham surgery, only skin incision and blunt dissection were performed. After injury, skin was sutured, and mice were left to recover on a heated pad before being returned to their home cages. Mechanical and thermal thresholds were measured two days after the surgery.
CFA injection
As previously described52, mice were anaesthetized with isoflurane (2%). Five microlitres of CFA was injected into the plantar surface of the left hind paw. Mechanical and thermal thresholds were measured one to three days after CFA treatment.
Neonatal spinal cord injection
The neonatal intraspinal cord injection method was modified from a previously published method10. Neonatal pups were injected within 1.5–2.5 days after birth. The pups were covered in aluminium foil, then surrounded in ice for 3–4 min until all movement stopped and the skin colour changed from pink to purple. One to three microlitres of rAAV vector containing 0.04% Trypan blue (for visualization of the injection site) was slowly injected into the spinal cord of cryoanaesthetized neonates using 5-μl syringes (1 inch needle, 30° bevel; Hamilton Company). Only pups in which a blue line in the back of the body could be clearly seen were used for experiments. After injection, pups were recovered on a warming blanket until their skin colour changed to pink; their body movements were observed and they were then returned to the home cage. The neonatal injection did not lead to retrograde labelling of extra neurons in the RVM (Extended Data Fig. 2b,c).
Adult spinal cord injection
The experiments in Fig. 5 were performed using adult spinal cord injection to avoid potential toxicity from long-term AAV1-Cre expression. A dorsal laminectomy was performed at vertebra level T12 to expose the spinal cord, followed by removal of the dura mater. Then, 250 nl of AAV1-hSyn-Cre was injected into the spinal cord 0.3–0.4 mm lateral to the central blood vessel and 0.3 mm below the surface of the spinal cord. Four injections were performed on each side of the spinal cord at a space of 0.5 mm in the anterior-to-posterior direction.
Fibre photometry
Fibre photometry experiments were performed as previously described53 at least four weeks after AAV8-hSyn-FLEX(FRT)-jGCaMP7s was injected into the RVM of Oprm1cre/+ mice receiving neonatal intraspinal cord injection of AAV8-retro-hSyn-FLEX(LoxP)-mTagBFP-P2A-FlpO, or after AAV8-hSyn-FLEX(FRT)-jGCaMP7s was injected into the lSuC of vGlut2cre/+ mice receiving RVM injection of AAV8-retro-hSyn-FLEX(LoxP)-mTagBFP-P2A-FlpO. The implanted fibre was connected to a fibre optic metre (FOM-02M, C-Light) through an optical fibre patch cord (400 μm, 0.50 NA; Inper). Mice were habituated for three days (30 min each) to fibre tethering before fibre photometry recording. To record fluorescence signals, a beam from a 480-nm LED was reflected with a dichroic mirror, and a lens connected to a CMOS detector (DCC3240M, Thorlabs) was used to focus the beam to record fluorescence data. At the tip of the patch cord, the LED power was less than 50 μW. A LabVIEW program (v.2018) was used to control the CMOS camera to record the fluorescent signal. Using an RZ5D processor (Tucker-Davis Technologies), the analogue voltage signal was digitalized, filtered (200 Hz low-pass) and sampled at 3 kHz. OpenEx software (v.2.36, Tucker-Davis Technologies) was used to record the fibre photometry data, and a custom MATLAB script (MathWorks) was used for data analysis. To record mechanical-stimulation-evoked responses in uninjured and SNI mice, 4 g and 0.4 g von Frey fibre, respectively, was applied to the lateral part of the plantar surface of the hind paw four to six times, with a 30-s interval between each stimulation. For thermal stimulation, an infrared laser (70% of maximum power, Ugo Basile) or dry ice was applied to the plantar surface through a glass plane underneath the hind paw four to six times with a 30-s interval between each stimulation. For the CFA-injected group, 4 g (before, and day 21 after CFA) and 0.4 g (day 2 and day 7 after CFA) von Frey fibre was applied to the plantar surface of the hind paw four to six times with a 30-s interval between each stimulation. For thermal stimulation, an infrared laser (70% of maximum power, Ugo Basile) was applied to the plantar surface through a glass plane underneath the hind paw four to six times with a 30-s interval between each stimulation. The video recording was synchronized with the fibre photometry recording through a TTL signal. The fluorescence change (ΔF/F) was calculated as (F − F0)/F0, where F0 is the averaged fluorescence signal during a 3-s baseline period before the onset of withdrawal reflex in each trial. The area under the curve (AUC) was calculated as the integration of ΔF/F during each trial.
To assess the correlation between fibre photometry signals and locomotor speed, each individual mouse was placed in a 25 × 45-cm arena. Locomotion bouts (four to six per mouse) were identified, and the time course of each bout was normalized to a 0–100% scale. Data from a peri-event window (−50% to 150%) were extracted for analysis. The corresponding photometry signals and locomotor speeds were then obtained. Pearson’s correlation analysis was performed between the average photometry signal and the average locomotor speed during the first half of the locomotion bout (−50% to 50%) to quantify the relationship between neuronal activity and movement (spontaneous locomotion or pain-evoked escape).
Chemogenetic manipulation
For chemogenetic activation or silencing experiments, 0.1 mg kg−1 clozapine was injected (i.p.) 30 min before behaviour tests. For terminal silencing experiments, 300 nl of 5 μM clozapine was infused into each target through a cannula 30 min before behaviour tests.
Behavioural tasks
von Frey test
Each mouse was habituated in a red plastic cylinder on an elevated wire grid for at least one hour before testing. Mechanical sensitivity was determined with a set of calibrated von Frey filaments (0.02–4 g, Ugo Basile). For the SNI model, filaments were applied to the lateral part of the left hind paw. Between individual measurements, von Frey filaments were applied at least 3 s after the mice had returned to their initial resting states. A positive withdrawal response was defined as a brisk paw withdrawal, shaking or licking directed at the stimulated paw. Movements related to general locomotion, weight shifting, grooming or exploratory behaviour were not considered withdrawal responses and were excluded from the analysis. The 50% paw withdrawal threshold was determined using Dixon’s up-and-down method18.
Hargreaves test
Each mouse was habituated in a red plastic cylinder on a glass floor for at least one hour before to testing. A radiant heat beam (Hargreaves apparatus, Ugo Basile) was focused onto the left hind paw. The latency to hind paw withdrawal was recorded with at least two trials per mouse repeated at least 10 min apart. A cut-off latency of 20 s was set to avoid tissue damage.
Plantar cold test
Each mouse was habituated in a red plastic cylinder on a glass floor for at least one hour before testing. The test was performed by applying a dry-ice pellet to the plantar surface of the hind paw through a glass floor. The pellet was prepared by packing powdered dry ice into a modified syringe. The latency to paw withdrawal was recorded.
Formalin test
eGFP- or hM4D-expressing mice were infused with clozapine 30 min before the test. Twenty microlitres of 2.5% formalin was injected into the dorsal surface of the hind paw. Paw licking or biting duration were quantified during phase I (0–10 min after formalin injection) and phase II (11–40 min after formalin injection).
Affective–motivational pain behaviours
Affective–motivational responses were evaluated as previously described25. Each mouse was habituated in a red plastic cylinder on a glass floor for at least one hour before testing. Mice received a series of mechanical stimuli using von Frey filaments (0.07 g, light touch; 0.4 g, mild touch; 2.0 g, moderate touch). Each filament was applied 10 times per session at 20–30-s intervals, with 60-s pauses between stimulus blocks. The time spent attending to the injured paw (intentional lifting or licking) and performing escape behaviours (accelerating away or rearing toward chamber openings) was quantified.
Spontaneous pain behaviours
Spontaneous pain behaviours were evaluated as previously described26. Mice were habituated to the observation chamber for three days (30 min per day) before video recording. Mice were placed in a transparent plastic box (10 × 10 × 10 cm) on a glass floor. Spontaneous pain was quantified from 30-min video recordings (bottom view). Flinching and licking behaviours were scored as 1 and 2, respectively; licking during grooming was excluded.
Mouse facial-grimace scale
Facial grimacing was assessed as described27. Mice were habituated to the observation chamber for three days (30 min per day) before video recording. In brief, each mouse was placed in a white wooden chamber (9 × 9 × 9 cm with a 2-cm floor extension) for an 8-min video recording. Videos were scored online (https://painface.net) using a 0–2 scale for orbital tightening, ear position, whisker change and nose bulge.
Air-puff-evoked blink response
The air-puff test was based on a previously described method54. Head-fixed mice were habituated on a running wheel for three days. The periocular area was recorded under infrared illumination. Compressed air (20 psi) was delivered in 60-ms pulses every 3 s via polyethylene tubing positioned 2.5 mm from the right eye. Each trial consisted of eight puffs, and blink responses were quantified from three or four consecutive trials, with at least one minute between trials. Bonsai-rx software (v.2.8) was used to control simultaneous video recording and air-puff timing, and to crop the recording area.
Conditioned place aversion test
The conditioned place aversion (CPA) assay was based on a previously described method55. In brief, mice were habituated for three days (30 min each) to a custom-designed two-compartment CPA apparatus (30 cm × 25 cm × 20 cm) placed on an elevated mesh rack. Each chamber contained unique visual cues (black and grey stripes or plain grey walls). On the final day of habituation, baseline preferences were video-recorded for 10 min and movement was tracked using the custom tracking software running on MATLAB (MathWorks). After baseline measurements, mice were confined to their preferred side of the chamber and paired with repeated stimulation of the left hind paw once every 10 s for 10 min using a 0.16-g filament. After pairing, mice were returned to their home cage for 20 min before being re-exposed to the CPA chamber with free access to both side of the CPA chamber for 10 min. CPA scores were calculated by subtracting the time spent in the filament-stimulation-paired side of the chamber during baseline from the time spent in the same side of the chamber during the re-exposure.
Open field test
Each mouse was placed in a square arena (50 × 50 cm) with a defined centre zone (30 × 30 cm). Locomotor activity and time spent in the centre were recorded and analysed as measures of exploratory drive and anxiety-like behaviour.
Elevated plus maze
The elevated plus maze (EPM) consisted of two open and two enclosed arms (each 30 cm long), elevated above the floor. Mice were placed at the central junction facing an open arm and allowed to explore for 5 min. The time spent in the open arms was analysed as an index of anxiety-like behaviour.
Tail suspension test
Mice were suspended by the tail for 6 min in an enclosed chamber (55 cm (H) × 15 cm (W) × 11.5 cm (D). Total immobility time was analysed.
Locomotion test
Mice were habituated for three days (30 min each) to a custom-designed apparatus (50 cm × 50 cm × 30 cm). On consecutive days, mice were injected (i.p.) with saline, clozapine (0.1 mg kg−1, Cayman Chemical) or morphine (15 mg kg−1, Hikma), and locomotor activity was measured for 10 min (for chemogenetic manipulation) or 30 min (for morphine-induced locomotion).
Textured novel object recognition test
The textured novel object recognition test (NORT) was based on a previously described method44. Bilateral whisker plucking was performed three days before the habituation session. Mice were habituated to the behaviour chamber for 10 min 24 h before the familiarization session. In the familiarization session, the mouse was placed in the chamber containing two copies of identical objects for 10 min, and was then removed from the chamber and placed in a transport cage for 5 min. Next, the mouse was reintroduced to the chamber and presented with the familiar object and a novel object that differ only in texture. For both sessions, the experiments end when there has been a 20-s physical interaction of both objects or when a 10-min period has been reached. The discrimination index was calculated as the change in the percentage of time spent on the selected object in each session.
Textured conditioned place preference
In brief, mice were habituated for three days (30 min each) to a custom-designed two-compartment CPA apparatus with unique visual cues in each compartment (30 cm × 25 cm × 20 cm). Baseline preferences were video-recorded for 10 min and movement was tracked using the custom tracking software running on MATLAB (MathWorks). Next, the floor of the less-preferred side of the chamber was covered with fine-grit sandpaper, whereas the other side was left as smooth plexiglass. For texture pairing, the mouse was then reintroduced to the chamber, and movement was video-recorded and tracked. Thirty minutes after clozapine infusion, the mouse was placed back into the chamber, and the difference in the time spent in the sandpaper side between the pairing and the test was calculated.
Measurement of heart rate and breathing rate
Measurements of heart rate were performed as previously described56. In brief, after anaesthetization with isoflurane, two electrodes were connected to the forelimb and hindlimb of the mice. The electrocardiogram signal was filtered (10 Hz–500 Hz), amplified (×100) with an amplifier, digitized (10 kHz) and stored with Spike 2 software (v.7.03). For breathing rate, the skin on top of the most posterior rib was tied and connected to a customized force transducer, which vibrates during each breathing cycle. The changes in voltage caused by the vibration of the force transducer were filtered (10 Hz–500 Hz), amplified (×100) with an amplifier, digitized (10 kHz) and stored with Spike 2 software (v.7.03).
Electrophysiology
Four weeks after AAV injection, mice (eight to nine weeks old) were deeply anaesthetized and transcardially perfused with ice-cold cutting solution containing (in mM) 92 N-methyl-d-glucamine (NMDG), 2.5 KCl, 1.25 NaH2PO4, 25 d-glucose, 20 HEPES, 2 thiourea, 5 Na-ascorbate, 3 Na-pyruvate, 30 NaHCO3, 12 N-acetyl-l-cysteine, 10 MgSO4, 0.5 CaCl2 and 0.005 2,3-dihydroxy-6-nitro-7-sulfamoyl-benzo[f]quinoxaline (NBQX) (pH 7.2). Acute coronal slices (250 μm) containing RVM were made using a vibratome (VT1000S, Leica), and recovered in cutting solution without NBQX, and then for at least one hour in aCSF containing (in mM) 125 NaCl, 2.5 KCl, 1.25 NaH2PO4, 10 d-glucose, 1 MgCl2, 26 NaHCO3 and 2 CaCl2 (pH 7.3) at room temperature. All slice recordings were done in room-temperature artificial cerebrospinal fluid (aCSF) continuously perfused with O2 balanced with 5% CO2.
Whole-cell patch-clamp recordings were obtained in RVM cells located adjacent to midline (less than 150 μm lateral from midline). For current clamp recording, glass microelectrodes (3–7 MΩ) were filled with internal solution containing (in mM) 130 K-gluconate, 1 KCl, 10 HEPES, 10 EGTA, 1 MgCl2, 1 CaCl2, 2 Mg-ATP and 0.2 Na-GTP (pH 7.3). Neurobiotin (0.3% w/v, Vector Laboratories) was also included to label recorded neurons. Descending RVM neurons were identified by the expression of Clover3 under a 40× water-immersion objective lens using a fluorescence microscope (BX51WI, Olympus). The baseline firing rate was monitored for 3 min before and after application of drugs. DAMGO (1 μM, Tocris) was bath-applied with or without CTAP (1 μM, Cayman Chemical) for 10 min. Cells exhibiting more than 20% variance in baseline firing rate were excluded from further analyses. Action potentials were detected and counted using Clampfit v.10.2 (Molecular Devices).
For voltage-clamp recordings, internal solution containing (in mM) 130 CsMeSO3, 1 MgCl2, 1 CaCl2, 11 EGTA, 10 HEPES, 2 Mg-ATP, 0.2 Na-GTP and 5 QX314 (Tocris) was used. Picrotoxin (100 μM) was bath-applied throughout the recordings. RVM cells were held at −70 mV, and a 2-ms pulse of 470-nm blue light was emitted with an LED driver (M470L2, Thorlabs) every 15 s to activate ChR2-expressing axon terminals. After monitoring baseline oEPSCs for 5 min, clozapine-N-oxide (5 μM, Cayman Chemical) was bath-applied for 15 min to activate hM4D. Amplitudes of oEPSCs from baseline and the last 5 min of drug application were analysed. All chemicals were obtained from Sigma unless specified otherwise.
After whole-cell patch-clamp recording, slices were fixed with 4% paraformaldehyde (PFA) in PBS at 4 °C overnight. Fixed slices were further sectioned to 50 μm using a vibratome and washed with PBS three times. Tissues were then incubated with streptavidin conjugated to Alexa Fluor 647 (1:1,000, Thermo Fisher Scientific) in PBS containing 0.5% Triton X-100 overnight at room temperature. Sections were then washed with PBS three times. Z-stacks of confocal fluorescent images were taken with Airyscan2 (LSM980, ZEISS).
For experiments in Fig. 5b, AAV8-retro-mCherry was injected into the lSuC and AAV8-ChR2 was injected into the Po or VPL. Slices were prepared four or five weeks after virus injection. A 2-ms pulse of 470-nm blue light was emitted with an LED driver (M470L2, Thorlabs) every 15 s to activate ChR2-expressing axon terminals.
cTRIO tracing and analysis
Experiments in Figs. 3c–e and 4a,b were performed in Oprm1cre+/− mice with neonatal spinal cord injection of AAV8-retro-hSyn-FLEX(LoxP)-mTagBGFP-P2A-FlpO into the spinal cord, and in vGlut2cre+/− mice with injection of AAV8-retro-hSyn-FLEX(LoxP)-mTagBGFP-P2A-FlpO into the RVM, respectively. Two to six weeks later, 200 nl of AAV8-hSyn-FLEX(FRT)-EGFP-P2A-TVA-T2A-oG was injected into the RVM or lSuC using a stereotaxic instrument (BenchMARK Digital, Leica). Four weeks later, 200 nl SADΔG-mCherry(EnvA) or CVS-N2cΔG-mCherry(EnvA) was injected into the same area of the RVM or lSuC using the procedure described above. Mice were housed in a biosafety level 2 (BSL2) facility for seven days before being euthanized. For quantifications of long-range-input brain regions, brain regions 1 mm anterior or posterior to the injection site were excluded from analysis. Images were taken from consecutive 50-μm coronal sections using a ZEISS Axioplan2 with a 2.5× or 5× objective. Cell counting was performed manually using Fiji. For quantifications of subregions, boundaries were based on the Allen Institute’s reference atlas (https://mouse.brain-map.org/experiment/thumbnails/100048576?image_type=atlas). No adjustment was made for potential double counting of cells from consecutive sections. Fractional input was calculated by dividing the number of labelled neurons in each brain region by the total number of labelled neurons throughout the entire brain.
Ablation of OPRM1+ RVMSC neurons
AAV8-hSyn-FLEX(FRT)-taCaspase3-TEVp and AAV8-hSyn-FLEX(LoxP)-Ruby3-FLEX(FRT)-Clover3 were co-injected into the RVM of Oprm1cre/+ mice with neonatal injection of AAV8-retro-hSyn-FLEX-mTagBFP-P2A-FlpO (1 μl) into the spinal cord. For control mice, AAV8-hSyn-FLEX(LoxP)-Ruby3-FLEX(FRT)-Clover3 was injected into the RVM. The infected OPRM1+ RVM neurons express mRuby3 (red), and OPRM1+ RVMSC neurons express both mRuby3 and Clover3 (yellow). Four weeks later, after behavioural tests, the brains and spinal cords were collected from both groups for histological analysis.
Immunostaining and RNAscope in situ hybridization
Mice were deeply anaesthetized with pentobarbital sodium solution and transcardially perfused with PBS, followed by 4% PFA in 1× PBS at room temperature. Brains and spinal cords were dissected from perfused mice and post-fixed in 4% PFA in 1× PBS at 4 °C overnight, cryoprotected in 30% sucrose in 1× PBS at 4 °C overnight, embedded in OCT compound, frozen using dry ice and kept at –80 °C. Brains and spinal cords were cryosectioned (14 μm for RNAscope in situ hybridization or 50 μm for immunostaining) using a cryostat (Leica). For immunostaining, 50-μm sections were washed three times for 5 min each with 1× PBS. They were then incubated in a blocking solutions (0.3% PBST containing 10% normal donkey serum (LAMPIRE Biological Products 7332100)) for two hours at room temperature. Subsequently, the sections were incubated with primary antibodies diluted in 0.3% PBST containing 3% normal donkey serum overnight at 4 °C. After three 10-min washes with PBS, the sections were incubated with secondary antibodies diluted in 0.3% PBST containing 5% normal donkey serum for two hours at room temperature. After this, the sections were washed three times for 10 min each with PBS; Hoechst 33342 solution (Thermo Fisher Scientific) was included in the second wash at a 1:10,000 dilution. Finally, the sections were mounted with Fluoromount-G (Southern Biotech). The primary antibodies used in this study included rabbit anti-mCherry (1:1,000, 600401397, Rockland), rabbit anti-FOS (1:1,000, 226003, Synaptic Systems), goat anti-TPH2 (1:500, ab121013, Abcam) and mouse anti-HA (1:1,000, 901514, Biolegend). Secondary antibodies included Alexa-594- or 647-conjugated donkey anti-rabbit antibodies, Alexa-647-conjugated donkey anti-mouse antibodies and Alexa-647-conjugated anti-goat antibodies. All secondary antibodies were purchased from Life Technologies and used at a 1:1,000 dilution. For RNAscope in situ hybridization, 14-μm sections were collected on glass slide and mRNA transcripts were detected using the RNAscope Fluorescent Multiplex Assay (Advanced Cell Diagnostics) and RNAscope Fluorescent Multiplex Reagent Kit v2 (323100). The RNAscope catalogue probes were used to detect Oprm1 (493251), vGat (319191), vGlut2 (319171), Tph2 (318691) and Penk (318761) RNA molecules. Images were obtained using a ZEISS 710 confocal microscope using either 10× (Plan-Apochromat 10×, NA 0.45) or 20× (Plan-Apochromat 20×, NA 0.8) objectives. For imaging large sections of spinal cord and brain, the tile-scan function was used and the tile images were stitched using ZEISS Zen microscope software.
For FOS immunostaining, each SNI mouse was habituated in a red plastic cylinder on a glass floor for at least one hour before to testing. The left hindpaws were repeatedly stimulated once every 10 s for 10 min using a 0.16-g filament (SNI mice), or stimulated with a 1.4-g filament 90 times for 10 min (non-injured mice). Mice were perfused 1.5 h after the delivery of each stimulation, then processed for FOS immunohistochemical analysis.
Two-dimensional registration of RVM descending neurons and 3D visualization
Thirty to forty brain slices (50 μm) containing the RVM were scanned using Olympus VS120 for two-dimensional (2D) registration. Custom MATLAB software was used to remove all image features outside the brain slices. Background subtraction and contrast enhancement of the Neurotrace 640 channel were then applied. The processed Neurotrace 640 images for each section were then serially analysed using a combination of automated and manual methods. For a more detailed description of this procedure, see a previous report57. Instructions and custom codes written in MATLAB for 2D image registration can be found at https://sites.google.com/view/brain-mapping/home/code.
TESOS imaging and single-cell tracing of OPRM1+ RVMSC neurons
AAV8-EF1α-FLEX(LoxP)-mScarlet was injected into the brainstem of Oprm1cre/+ mice (200 nl at Bregma −5.6 mm, lateral ±0.1 mm, ventral 5.75 mm). Six weeks after AAV injection, Mice were deeply anaesthetized with pentobarbital sodium solution and transcardially perfused with PBS, followed by 4% PFA in 1× PBS at room temperature. Brains and spinal cords were dissected and post-fixed in 4% PFA in 1× PBS at 4 °C overnight. The brain and spinal tissues were then subjected to the TESOS clearing procedure through passive immersion, and the transparent embedding was performed 48 h after sample transparency, as previously described12. Confocal images of transparently embedded samples were obtained using an upright Nikon confocal microscope combined with a rotary microtome using the 40× objective, and reconstructed using custom software provided by the laboratory of H. Zhao. Manual tracing of axons was performed using Lychnis (https://github.com/SMART-pipeline/Lychnis-tracing)58.
Statistical analysis
No statistical methods were used to predetermine sample size. However, the sample sizes were comparable to those in previous publications. All analyses were performed using GraphPad Prism software and statistical methods are indicated when used. Normality was assessed for each dataset before analysis. In cases in which data did not meet the assumption of normality, appropriate non-parametric tests were used. When a t-test was used, it was performed as a two-tailed test. No method of randomization was used in any of the experiments. Experimenters were not blinded to group allocation in behavioural experiments, but CPA scores were measured automatically by custom tracking software running in MATLAB (MathWorks). All mice that completed the entire behavioural training and testing were included in the analysis. Unless otherwise indicated in the figure legend, data points are derived from individual mice and are presented as mean ± s.e.m.
Reporting summary
Further information on research design is available in the Nature Portfolio Reporting Summary linked to this article.
