
I knew we had significant concerns about trucking insurance, given the rising underwriting absence rates. Instant issue policies are increasingly prevalent, particularly among the worst-performing fleets. What I found was a massive hole in the regulatory framework so large that you could drive a truck through it. Based on the numbers, someone already has. About 589,690 times.
I’ve held a CDL for over 25 years. I’ve managed fleets, owned fleets. I consult for Fortune 500 carriers; I’ve overseen large, multi-entity private equity fleets; I’ve testified as an expert witness in highway accident litigation; and I have spent the better part of my career within the compliance machinery of American trucking. I thought I understood how the system worked. Most would have you believe I know more about the U.S. truck insurance market than most. Then I started pulling that data.
An analysis of 2.8 million insurer-carrier relationships in FMCSA data reveals extreme crash concentration: the top 5% of carriers by insurer portfolio risk account for 31.9% of all crashes and 31.8% of all fatalities. The reason? No federal or state law requires insurance companies to evaluate a motor carrier’s safety record before issuing a policy. The $750,000 federal minimum hasn’t changed since 1980. The result is a system where insurance is a financial barrier to entry but not a safety gate.
What the data says
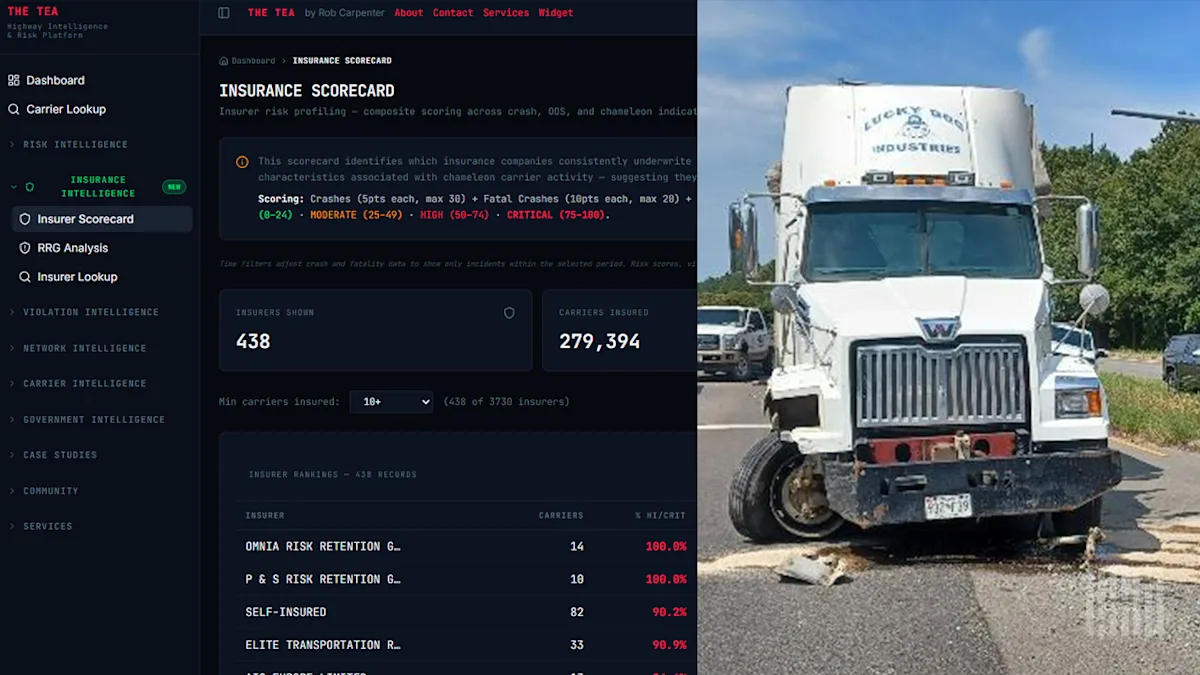
I analyzed 2.8 million insurer-carrier relationships in the FMCSA’s public data. You can see my insurance scorecards on my site here; each trucking carrier profile also includes an insurance risk rating. Every active insurance filing for every interstate for-hire motor carrier in the United States. Then I scored each carrier using a peer-normalized risk framework that evaluates crash severity, inspection quality, authority stability, and compliance patterns within fleet size cohorts. The scores were aggregated to the insurer portfolio level.
Insurer portfolios in the highest-risk tier, with average risk scores between 21 and 50 on a 100-point scale, cover just 1.8% of all carriers. But those carriers account for 16.9% of all crashes and 16.6% of all fatal crashes in the dataset. The weighted crash rate per carrier in this tier is 58.9. In the lowest tier, it’s 1.13. That’s an insane difference.
When I ranked carriers by the riskiness of their insurer’s portfolio and computed cumulative crash shares, the concentration curve was almost vertical. The top 5% of carriers account for 31.9% of all crashes and 31.8% of all fatal crashes. At 25%, the curve captures 70.1% of both.
